Gnuplot is a software that is used to produce the quality graph. Furthermore, among researchers, Gnuplot is very popular for articles publication.
Download Gnuplot
Link to download
Procedure to plot a graph using Gnuplot commands
Step-1: Write These commands in a file
set terminal jpeg;
set output “cbr_thp.jpeg”;
set xlabel font “Times-Roman, 20”;
set xtics font “Times-Roman, 20”;
set ylabel font “Times-Roman, 20”;
set ytics font “Times-Roman, 20”;
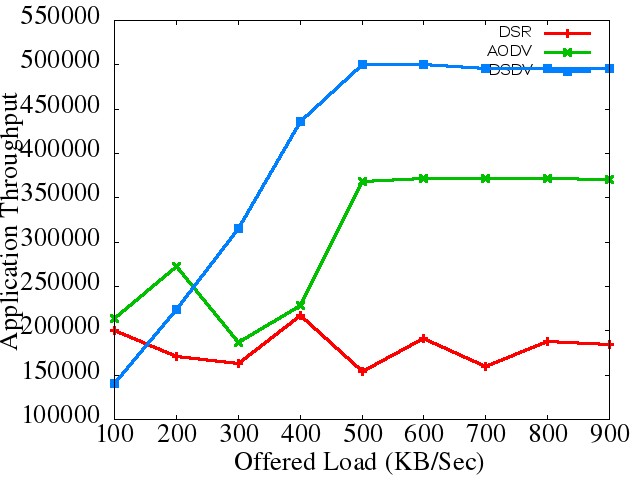
set xlabel “Offered Load (KB/Sec)”;
set ylabel “Application Throughput” ;
plot “cbr_thp.txt” using 1:2 with linespoints title “DSR” ls 1 lw 3, “cbr_thp.txt” using 1:3 with linespoints title “AODV” ls 2 lw 3, “cbr_thp.txt” using 1:4 with linespoints title “DSDV” ls 3 lw 3;
Step-2: Name the file cbr_thp.plt
Step-3: Make a data file
See the file cbr_thp.txt
Note- cbr_thp.txt and cbr_thp.plt should be in the same directory.
Step-4: Go to the Gnuplot command line prompt.
Step-5: Type
load ‘cbr_thp.plt’
Finally, this graph will be produced.
Conclusion- To sum up, in this post I have demonstrated how to plot a graph using Gnuplot. Hope it will help you to produce quality graphs.