Skewness and Kurtosis-
Introduction-
Skewness and Kurtosis are very important concepts in statistics and have several applications. In addition, they characterize the nature of data distribution which make data analysis easier. Moreover, I will separately discuss skewness and kurtosis in further sections.
Skewness-
Skewness refers the measurement of lack of symmetry in data distribution. Measures of skewness has applications in data analytics, machine learning and data science in per-processing of data. Moreover, if mean, median and mode of a data distribution coincides i.e mean = median = mode then. Then data set has skewness 0 i.e there is no asymmetry in data set.
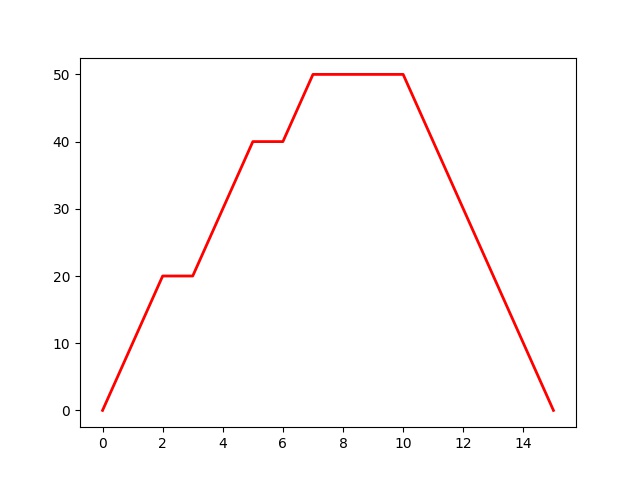
Suppose a data set
0,10, 20,20, 30, 40,40,50,50, 50,50,40,30,20,10,0
Mean: 28.75
Median: 30.0
Mode: 50
Standard Deviation: 17.275343701356565
Skewness : -0.24321198774750508
The value of coef. of skewness is negative and this type of skewness in data distribution is called negative skewness.
Formula of skewness
Coef. of Skewness = 3(Mean-Median) /Standard Deviation
The statistics are calculated using the following python code
Python Code for Calculating Coefficient of Skewness
from scipy.stats import skew
import numpy as np
import statistics
import matplotlib.pyplot as plt
x = [0,10, 20,20, 30, 40,40,50,50, 50,50,40,30,20,10,0]
print(x)
mean= np.mean(x)
median= np.median(x)
mode= statistics.mode(x)
std=np.std(x)
print("Mean:", mean)
print("Median:", median)
print("Mode:", mode)
print("Standard Deviation:", std)
lines = plt.plot(x)
plt.setp(lines, color='r', linewidth=2.0)
print( "Skewness :" , skew(x))
plt.savefig("skewness.jpg")
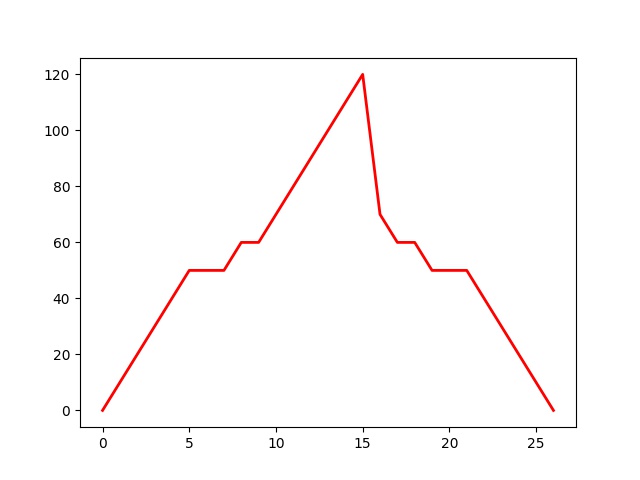
 Consider another data set
0,10, 20, 30,40,50,50,50,60,60,70,80,90,100,110,120,70,60,60, 50,50,50,40,30,20,10,0
Mean: 51.111111111111114
Median: 50.0
Mode: 50
Standard Deviation: 30.83208205669246
Skewness : 0.32780083058284104
The value of coef. of skewness is positive and this type of skewness in data distribution is called positive skewness.
 Kurtosis-
Kurtosis measures “How much heavy tail a data distribution have”. Furthermore, it is used for outlier detection in a data set
that means how many values have different characteristics.
The formula for kurtosis is
Coef. Kurtosis =(X-μ)4/Variance
Python code for Kurtosis
import matplotlib.pyplot as plt
import numpy as np
import scipy.stats as stats
import math
from scipy.stats import kurtosis
mu = 0
variance = 1
sigma = math.sqrt(variance)
x = np.linspace(mu – 5*sigma, mu + 5*sigma, 50)
y1=stats.norm.pdf(x, mu, sigma)
print(“x”,x)
print(“y1”,y1)
plt.plot(x,y1)
print(“Kurtosis\n”, kurtosis(y1))
plt.savefig(“kurtosis.jpg”)
The normally distributed data set generated from the above python code is
1.48671951e-06 4.03963981e-06 1.05285406e-05 2.63211976e-05
6.31182642e-05 1.45183206e-04 3.20324125e-04 6.77914385e-04
1.37616968e-03 2.67966838e-03 5.00497661e-03 8.96674844e-03
1.54091915e-02 2.54001718e-02 4.01610804e-02 6.09096432e-02
8.86091674e-02 1.23646888e-01 1.65500632e-01 2.12484892e-01
2.61678710e-01 3.09115411e-01 3.50255414e-01 3.80680815e-01
3.96870719e-01 3.96870719e-01 3.80680815e-01 3.50255414e-01
3.09115411e-01 2.61678710e-01 2.12484892e-01 1.65500632e-01
1.23646888e-01 8.86091674e-02 6.09096432e-02 4.01610804e-02
2.54001718e-02 1.54091915e-02 8.96674844e-03 5.00497661e-03
2.67966838e-03 1.37616968e-03 6.77914385e-04 3.20324125e-04
1.45183206e-04 6.31182642e-05 2.63211976e-05 1.05285406e-05
4.03963981e-06 1.48671951e-06
Pot of data is
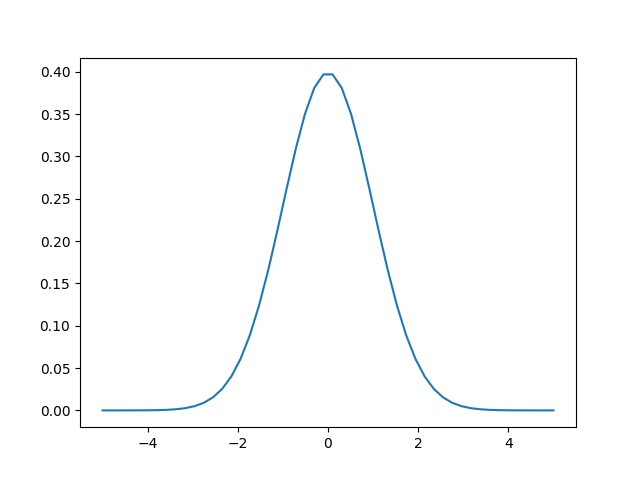 And kurtosis is -0.24249670483561347
Conclusion-
I this post, I have explained about skewness and kurtosis which is very important to understand data distribution. These both data analytics method are very important in machine learning, data science and big data analytics. Hope all these concepts I have explained will help you.