Measures of central tendency in statistics refers to a value which characterizes all the the data. Mean, median and mode are very important measures of central tendency. Measures of central tendency is very fundamental in data science, machine learning and data analytics areas. Moreover, if you want to make a carrier in data analytics you have to go through concept of central tendency.
Important- To know about organization of data see the post
Frequency Distribution in Statistics
1- Mean-
Mean is a very frequent used measure of central tendency. Further, it is used for individual, discrete and continuous series data.
1.1 Mean for Individual Series Data-
Mean for individual series refers to sum of values divided by number of values. If x1, x2, x3,………………., xn are values then arithmetic mean for individual series is given by.
Mean=Σ(x1+x2+ x3,……………….+xn) / n
For example marks obtained by 10 students in a class 35, 28, 38, 25, 28, 38, 28, 45, 35, 38. The the mean of obtained marks will be.
Mean of Obtained Marks= (35+28+38+25+28+38+28+45+35+38)/10= 33.80
1.2 Mean for Discrete Series Data-
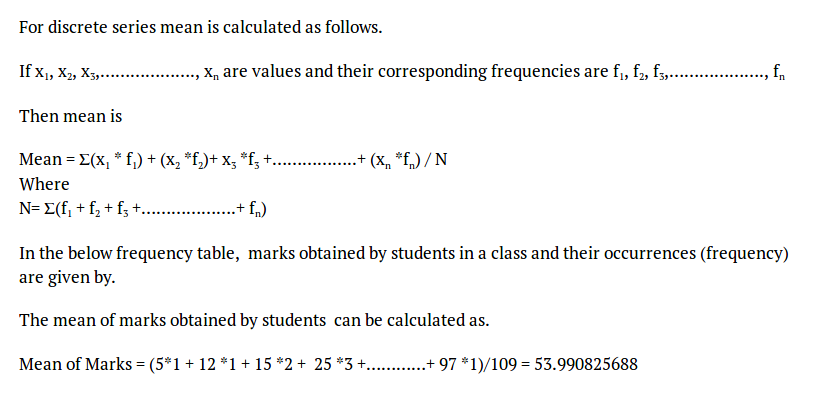
For discrete series mean is calculated as follows.
If x1, x2, x3,………………., xn are values and their corresponding frequencies are f1, f2, f3,………………., fn
Then mean is
Mean = Σ(x1 * f1) + (x2 *f2)+ x3 *f3 +……………..+ (xn *fn) / N
Where
N= Σ(f1 + f2 + f3 +……………….+ fn)
In the below frequency table, marks obtained by students in a class and their occurrences (frequency) are given by.
The mean of marks obtained by students can be calculated as.
Mean of Marks = (5*1 + 12 *1 + 15 *2 + 25 *3 +…………+ 97 *1)/109 = 53.990825688
Frequency Distribution
| Marks | Number of Students |
|---|---|
| 5 | 1 |
| 12 | 1 |
| 15 | 2 |
| 25 | 3 |
| 28 | 3 |
| 35 | 8 |
| 38 | 2 |
| 45 | 10 |
| 47 | 10 |
| 50 | 15 |
| 55 | 10 |
| 58 | 5 |
| 62 | 10 |
| 67 | 10 |
| 71 | 4 |
| 76 | 6 |
| 82 | 3 |
| 85 | 3 |
| 91 | 1 |
| 94 | 1 |
| 97 | 1 |
1.3 Mean for Continuous Series Data-
To calculate mean for continuous series data you have to follow this basic procedure.
For each class calculate middle value using this formula
Mi = (Lower Limiti + Upper Limiti) / 2
For example for row first in table
M1 = (0 + 10)/ 2 = 5
M2 = (10 +20) / 2 = 15
Replace xi with Mi in discrete series mean formula.
i.e
Mean = Σ(M1 * f1) + (M2 *f2)+ M3 *f3 +……………..+ (Mn *fn) / N
N= Σ(f1 + f2 + f3 +……………….+ fn)
Then mean for the data contained by table would be
Mean = (5 * 1 + 15 * 3 + 25 * 6 + 35 * 10 + 45 * 20 + 55 * 30 + 65 * 20 + 75 * 10 + 85 * 6 + 95 * 3) / 109
Mean = 54.541284404
| Marks ( In Class Intervals ) | Number of Students (Frequency) |
|---|---|
| 0-10 | 1 |
| 10-20 | 3 |
| 20-30 | 6 |
| 30-40 | 10 |
| 40-50 | 20 |
| 50-60 | 30 |
| 60-70 | 20 |
| 70-80 | 10 |
| 80-90 | 6 |
| 90-100 | 3 |
2- Median-
In a data set median is middle point and characterizes whole data set. Furthermore, it can be calculated for individual series data, discrete series data, and continuous series data.
2.1 Median for Individual Series Data
To calculate median of an individual series data you have to see whether number of data odd or even. Then short series data into increasing order.
2.1.1 Median for Individual Odd Series Data Set
If data list contain odd numbers of n values then calculate (n+1)/2 which will be the position of the median.
For example see the individual series data set
35, 28, 38, 25, 28, 38, 45
Arrange the data into increasing order
25, 28, 28, 35, 38, 38, 45
Number of data are 7 which is odd
Calculate (7+1)/2=4 term position ( value is 35)
Then median is 35
2.1.1 Median for Individual Even Series Data Set
If number of data points are even then you have to calculate n/2th and (n+2/2)th and take their average which will be median.
Again add one more value 50
Then series will be
25, 28, 28, 35, 38, 38, 45, 50
The number of data points 8, which is even
Then n/2th and (n+2)/2th term will be 35, and 38
Take their average
i.e (35 + 38)/2 = 36.5
Therefore median is 36.5
2.2 Median for Discrete Series Data
See the table below, it contains two columns values and their frequencies. To calculate median for discrete series you need to add another column cumulative frequency.
Frequency Distribution
| Marks | Number of Students |
|---|---|
| 5 | 1 |
| 12 | 1 |
| 15 | 2 |
| 25 | 3 |
| 28 | 3 |
| 35 | 8 |
| 38 | 2 |
| 45 | 10 |
| 47 | 10 |
| 50 | 15 |
| 55 | 10 |
| 58 | 5 |
| 62 | 10 |
| 67 | 10 |
| 71 | 4 |
| 76 | 6 |
| 82 | 3 |
| 85 | 3 |
| 91 | 1 |
| 94 | 1 |
| 97 | 1 |
Then the resultant table you can see below, and data values are already sorted.
To calculate median calculate N+1/2= 109+1/2 = 55 and corresponding median value is 50.
If number of data points are even you have to calculate N/2 and N+2/2 and take average of corresponding values.
| Marks | Number of Students | Cumulative Frequency |
|---|---|---|
| 5 | 1 | 1 |
| 12 | 1 | 2 |
| 15 | 2 | 4 |
| 25 | 3 | 7 |
| 28 | 3 | 10 |
| 35 | 8 | 18 |
| 38 | 2 | 20 |
| 45 | 10 | 30 |
| 47 | 10 | 40 |
| 50 | 15 | 55 |
| 55 | 10 | 65 |
| 58 | 5 | 70 |
| 62 | 10 | 80 |
| 67 | 10 | 90 |
| 71 | 4 | 94 |
| 76 | 6 | 100 |
| 82 | 3 | 103 |
| 85 | 3 | 106 |
| 91 | 1 | 107 |
| 94 | 1 | 108 |
| 97 | 1 | 109 |
2.3 Median for Continuous Series Data
To calculate median for continuous series data you have to see the formula
Median = L + [(N/2-F)/f] * w
Where L is lower limit
N is sum of frequencies
F is cumulative frequency before median class
f is frequency of median class
w is width of interval
See the table below there are two columns, you have to add another column cumulative frequency.
| Marks ( In Class Intervals ) | Number of Students (Frequency) |
|---|---|
| 0-10 | 1 |
| 10-20 | 3 |
| 20-30 | 6 |
| 30-40 | 10 |
| 40-50 | 20 |
| 50-60 | 30 |
| 60-70 | 20 |
| 70-80 | 10 |
| 80-90 | 6 |
| 90-100 | 3 |
The resultant table will be
| Marks | Number of Students | Cumulative Frequency |
|---|---|---|
| 0-10 | 1 | 1 |
| 10-20 | 3 | 4 |
| 20-30 | 6 | 10 |
| 30-40 | 10 | 20 |
| 40-50 | 20 | 40 |
| 50-60 | 30 | 70 |
| 60-70 | 20 | 90 |
| 70-80 | 10 | 100 |
| 80-90 | 6 | 106 |
| 90-100 | 3 | 109 |
From the above table
You can observe
N=109, N/2 = 54.5
Then median class is 50-60 and L = 50
You can also observe F= 40 , f=30 and w=10
Then median
Median = 50 +[ (54.5-40)/30] * 10
Median = 50 + 4.83 = 54.83
The the median is 54.83
3-Mode-
In essence, the value which appears frequent in data set is mode of a data set.
3.1 – Mode of Individual Series Data
Consider the data set 35, 28, 38, 25, 28, 38, 45, 35, 38. You can see that 38 appears 3 times which is most frequent occurrence. Then the mode of the data set is 38.
3.2 Mode of Discrete Series Data
See the data set
Frequency Distribution
| Marks | Number of Students |
|---|---|
| 5 | 1 |
| 12 | 1 |
| 15 | 2 |
| 25 | 3 |
| 28 | 3 |
| 35 | 8 |
| 38 | 2 |
| 45 | 10 |
| 47 | 10 |
| 50 | 15 |
| 55 | 10 |
| 58 | 5 |
| 62 | 10 |
| 67 | 10 |
| 71 | 4 |
| 76 | 6 |
| 82 | 3 |
| 85 | 3 |
| 91 | 1 |
| 94 | 1 |
| 97 | 1 |
You can observe that frequency of value 50 is highest which is 15. Then mode of discrete data series is 50.
3.3 Mode of Continuous Series Data
For continuous data series you have to use formula which is
Mode = L + (f1 – f0)/ (2 * f1 – f0 – f2)]
L is lower limit of the model class
where f1 is frequency of the modal class
where f0 is frequency of the pre-modal class
where f2 is frequency of the post-modal class
See the table you can observe that model class is 50-60.
(Modal class has the highest frequency)
And f1= 30
f0 = 20
f2 = 20
L=50
Then
Mode = 50 +[(30-20)/ (2 * 30 – 20-20)] = 50 + 0.50 =50.50
Then the mode of continuous data series will be 50.50.
| Marks ( In Class Intervals ) | Number of Students (Frequency) |
|---|---|
| 0-10 | 1 |
| 10-20 | 3 |
| 20-30 | 6 |
| 30-40 | 10 |
| 40-50 | 20 |
| 50-60 | 30 |
| 60-70 | 20 |
| 70-80 | 10 |
| 80-90 | 6 |
| 90-100 | 3 |
Conclusion-
To sum up, in this post I have explained about measurement of central tendency in statistics. Which is the first step towards learning statistics. I addition I have tried my best to make you understand hope it will be helpful for you.
References-
- Wilcox, R.R. and Keselman, H.J., 2003. Modern robust data analysis methods: measures of central tendency. Psychological methods, 8(3), p.254.
-
Smothers, C.D., Sun, F. and Dayton, A.D., 1999. Comparison of arithmetic and geometric means as measures of a central tendency in cattle nematode populations. Veterinary Parasitology, 81(3), pp.211-224.
- Web link Retrieved on 29.09.2019, Mean, median, and mode review , https://www.khanacademy.org/math/statistics-probability/summarizing-quantitative-data/mean-median-basics/a/mean-median-and-mode-review.
- Web link Retrieved on 29.09.2019, How to Calculate Median in 2 different Series? Explained! http://www.economicsdiscussion.net/central-tendency/how-to-calculate-median-in-2-different-series-explained/2465.
- Web link Retrieved on 29.09.2019, Calculation of Mean, Median and Mode, https://www.toppr.com/guides/economics/measures-of-central-tendency/calculation-of-mean-median-and-mode/