Frequency distribution in statistics refers to a graph or table which depicts or illustrate the occurrences of values.
Frequency distribution is very important in study of statistics, machine learning and data science area. To understand frequency distribution you have to understand organization of data.
Basically, there are three types of data organization techniques.
1- Individual Series Data
This type of data is basically raw data collected from somewhere. An example of students obtained marks in a class are given.
5, 12, 25, 15, 25, 15, 35, 28, 38, 25, 28, 38, 28, 45, 35, 38, 35, 35,35, 35, 35, 35, 45, 47, 45, 47, 45, 47, 45, 47, 45, 47, 45
47, 45, 47, 45, 47, 45, 47, 50, 47, 55, 50, 55, 50, 55, 50, 55, 50, 55, 50, 55, 50, 55, 50, 55, 55, 50, 55, 50, 58, 50, 58, 50, 58,
50, 58, 50, 58, 50, 62, 67, 62, 67, 62, 67, 62, 67, 62, 67, 62, 67, 62, 67, 62, 67, 62, 67, 71, 76, 71, 76, 71, 76, 71, 76, 82, 76, 82, 76, 82, 85, 91, 85, 94, 97, 85
The above data set is individually organized and this type of arrangement of data is called individual series data. In this type of data set inferring information takes lot of effort and time.
2- Discrete Series Data
The individual series data can be organized into more convenient tabular form using frequency distribution which is called discrete series data. In which, there are two columns, the first column contains values and the second one contains their occurrences (frequency). This type of data series can be easier to analyze compare to individual series data.
Frequency Distribution
| Marks | Number of Students |
|---|---|
| 5 | 1 |
| 12 | 1 |
| 15 | 2 |
| 25 | 3 |
| 28 | 3 |
| 35 | 8 |
| 38 | 2 |
| 45 | 10 |
| 47 | 10 |
| 50 | 15 |
| 55 | 10 |
| 58 | 5 |
| 62 | 10 |
| 67 | 10 |
| 71 | 4 |
| 76 | 6 |
| 82 | 3 |
| 85 | 3 |
| 91 | 1 |
| 94 | 1 |
| 97 | 1 |
You can notice from the table row one that marks 5 is obtained by only one student (frequency).
You can notice from the table row six that marks 35 is obtained by only 8 student (frequency).
3- Continuous Series Data
The discrete series data table can also be made short using class intervals. In which values are in a range in first column and their occurrences in another column . Which helps to analyze and interpret data in easier way.
See the same table using class interval. This is more convenient to analyze and understand than discrete series data
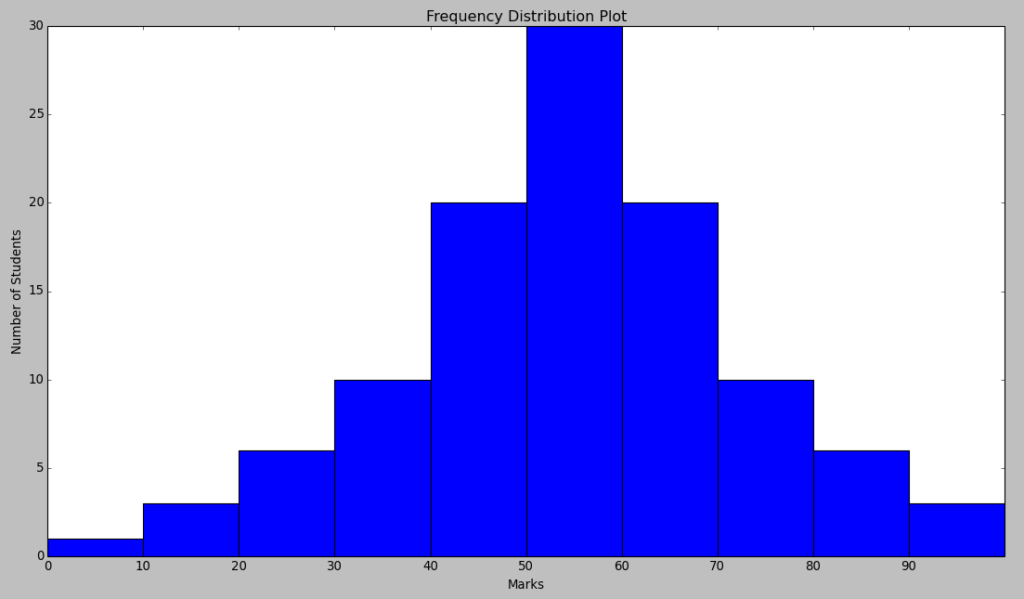
| Marks ( In Class Intervals ) | Number of Students (Frequency) |
|---|---|
| 0-10 | 1 |
| 10-20 | 3 |
| 20-30 | 6 |
| 30-40 | 10 |
| 40-50 | 20 |
| 50-60 | 30 |
| 60-70 | 20 |
| 70-80 | 10 |
| 80-90 | 6 |
| 90-100 | 3 |
Furthermore, the frequency distribution is also plotted below using bar graph. In graph at the x-axis marks and at the y-axis
number of students ( frequency ) are kept which is depicted below.

Conclusion-
In this post, I have explained about organization of data and frequency distribution hope it will help you to understand these concepts in statistics.