Spectrogram of Speech
What is a Spectrogram?
- Spectrogram — a visual representation of sound.
- Shows how the frequency content of a signal changes over time.
- Axes of a spectrogram:
- X-axis: Time (seconds)
- Y-axis: Frequency (Hz)
- Color / Intensity: Amplitude or Power (dB)
- Computed using the Short-Time Fourier Transform (STFT).
- Widely used in speech, music, and audio signal processing.
Steps to Generate Spectrogram in Python
- Load the audio file with
librosa.load(). - Compute STFT with
librosa.stft(). - Convert amplitude to decibels with
librosa.amplitude_to_db()for visualization. - Plot with
librosa.display.specshow().
Python Code
import librosa
import librosa.display
import matplotlib.pyplot as plt
import numpy as np

# Load the speech audio file
y, sr = librosa.load("stop.wav", sr=None)

# Compute Short-Time Fourier Transform (STFT)
D = librosa.stft(y)

# Convert to decibels (log scale for better visualization)
S_db = librosa.amplitude_to_db(np.abs(D), ref=np.max)

# Plot the spectrogram
plt.figure(figsize=(10, 5))
librosa.display.specshow(S_db, sr=sr, x_axis="time", y_axis="hz", cmap="magma")
plt.colorbar(format="%+2.0f dB")
plt.title("Spectrogram of Speech (stop.wav)")
plt.tight_layout()
plt.show()
Mathematical Explanation of STFT
- The speech signal in the time domain: \\(x(t)\\).
- Fourier Transform (no time info): \\(X(\\omega) = \\int_{-\\infty}^{\\infty} x(t) e^{-j\\omega t}\\, dt\\).
- STFT (sliding window) :
\\[
\\mathrm{STFT}\\{x(t)\\}(\\tau,\\omega) = \\int_{-\\infty}^{\\infty} x(t)\\, w(t-\\tau)\\, e^{-j\\omega t}\\, dt
\\] - Spectrogram is squared magnitude of STFT:
\\[
\\text{Spectrogram}(\\tau,\\omega) = \\left| \\mathrm{STFT}\\{x(t)\\}(\\tau,\\omega) \\right|^2
\\]
Output: Spectrogram of Speech
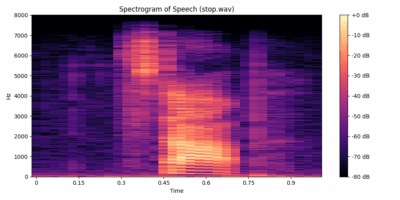
stop.wav.Use of STFT in Feature Extraction
- The raw audio \\(x(t)\\) is in time domain.
- STFT converts the signal into a time–frequency representation (spectrogram).
- From the spectrogram we extract features:
- Energy / Power Spectrum — loudness measures
- Pitch and Formants — speech characteristics
- MFCCs — Mel-Frequency Cepstral Coefficients, used in speech recognition
- These features feed ML models for:
- Speech recognition
- Speaker identification
- Emotion / sentiment analysis
Reach PostNetwork Academy
Website: www.postnetwork.co
YouTube: www.youtube.com/@postnetworkacademy
Facebook: www.facebook.com/postnetworkacademy
LinkedIn: www.linkedin.com/company/postnetworkacademy
GitHub: www.github.com/postnetworkacademy