Why is normal distribution is important?
To understand the question you have to go through the Central Limit Theorem.
Central Limit Theorem
According to central limit theorem if X1, X2, X3,……Xn are random variables drawn from any probability distribution function with mean Σμi and standard deviation Σσi where (i=1,2,3,……n). The sum of random variables X i.e X=X1+ X2 + X3+……+Xn with mean μ=Σμi and standard deviation σ=Σσi will approach to normal distribution.
Due to this theorem, this continuous probability distribution function is very popular and has several applications in variety of fields.
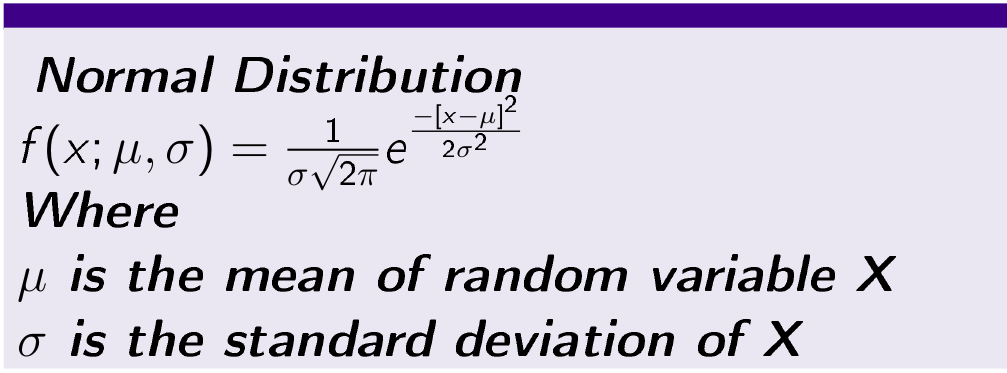
Normal Distribution
A random variable X is said to follow normal distribution with two parameters μ and σ and is denoted by X~N(μ, σ²). The normal distribution is also known as Gaussian distribution.
If it follows the following distribution function .
Further, a normal distribution with normal variate Z is called standard normal distribution with mean μ=0 and standard deviation σ=1 i.e Z~N(0,1).
and
Z= (X-μ)/ σ

Properties of Normal Distribution
- Normal distribution curve is a bell shaped.
- Normal distribution curve is symmetrical in which mean=median=mode and coincides at center.
- Skewness of normal distribution curve is 0.
- The total area under normal distribution curve is 1.
Solved Numerical Problems Related to Normal Distribution
Q- If X is normally distributed with mean 2 and standard deviation 9 then the calculate the probability distribution
P( 2<=X<=3) .
Solution-
In question
μ=2
and
σ²=1 i.e σ=1
Calculate Z using formula Z= (X-μ)/ σ for X=2
The we have Z=(2-2)/1= 0
Calculate Z using formula Z= (X-μ)/ σ for X=3
We get Z=(3-2)/1=1
Then we get probability distribution P(0<=Z<=1) corresponding to P( 2<=X<=3).
Here
P(0<=Z<=1) = P(Z<=1) – P(Z<=0)
The table Z (Click on the link to see Z table https://www.ztable.net/ ) to calculate are under P(Z<=1) – P(Z<=0)
=(0.50+0.3413)-(0.5+0.0)= 0.3413
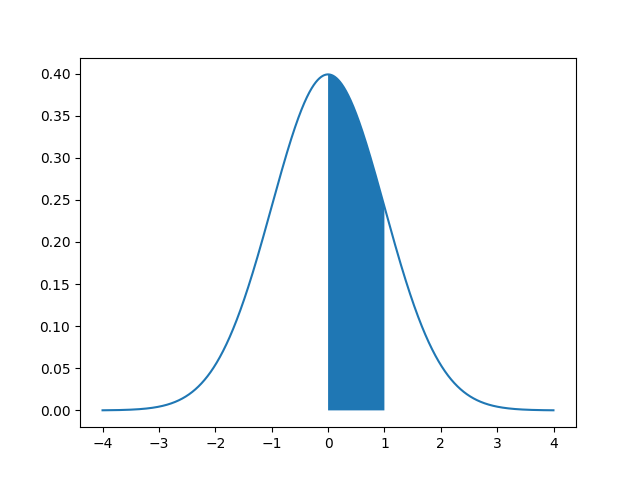
You can see area covered by P(0<=Z<=1) is 0.3413
Python Code to Plot Area Under Normal Distribution Curve
import numpy as np
import matplotlib.pyplot as plt
from scipy.stats import norm
mu=0
sigma=1
x = np.arange(-4,4,0.001)
y = norm.pdf(x, mu, sigma)
z = x[(0 < x) & (x < 1.0)]
plt.plot(x, y)
plt.fill_between(z, 0, norm.pdf(z, mu, sigma))
plt.savefig(“Normal Distribution.png”)
The output of the program would be the image
Applications of Normal Distribution in Data Science and Machine Learning
- SVM (Support Vector Machine) uses Gaussian kernel which is based on normal distribution.
- Gaussian Naive Bays classifier uses normal or Gaussian distribution.
- For hypothetical testing in statistics.
Conclusion-
In this post, I have explained about normal distribution or Gaussian distribution which is a very famous continuous probability distribution function. I has lot applications in machine learning and data science. Hope you will understand and apply it.
References