Linear regression
Linear regression refers to find out degree of relationship between two variables in the form of a linear function y=mx+c using statistical techniques. Where m is gradient and c is intercept on y axis.
That best fits the data set, which predicts the value of y for a given x or vice versa.
Applications
Linear regression analysis has a lot of applications in finance, biology, economics, social science and machine learning.
To understand the concept you will have to see the example.
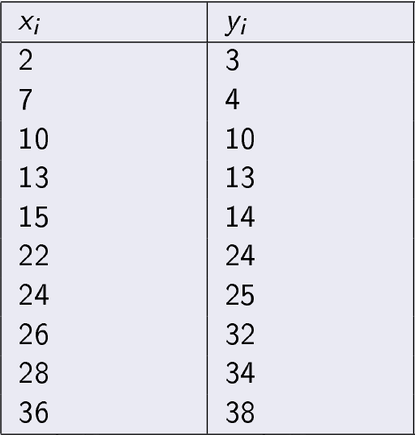
Consider a data set which has 10 instances
If we plot a scatter diagram using the Python code
import numpy as np
import matplotlib.pyplot as plt
u=[2,7,10,13,15,22,24,26,28,36]
v=[3,4,10,13,14,24,25,32,34,38]
x = np.linspace(0,40,38)
print(x)
y1=x+1
y2=x
y3=x-1
plt.subplot(1,3,1)
plt.title(“y=x+1”)
plt.scatter(u, v)
plt.plot(x, y1, ‘-r’)
plt.subplot(1,3,2)
plt.title(“y=x”)
plt.plot(x, y2, ‘-r’)
plt.scatter(u, v)
plt.subplot(1,3,3)
plt.title(“y=x-1”)
plt.plot(x, y3, ‘-r’)
plt.scatter(u, v)
plt.savefig(“scatter.png”)
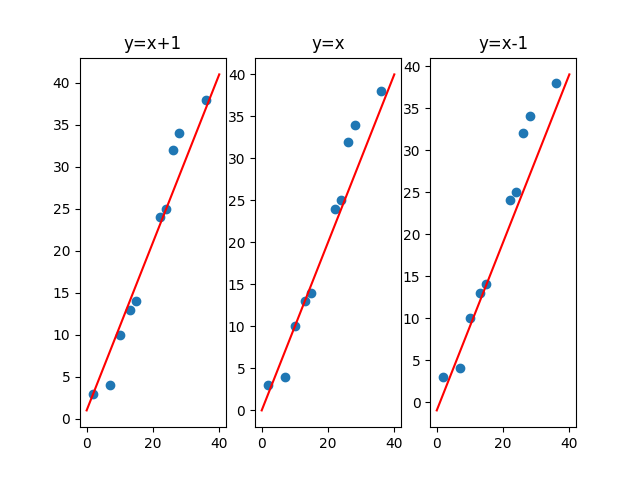
Again if we plot lines y=x+1, y=x, and y=x-1 with scatter diagram. It is difficult to observe which line best fit the data set.
Then we have to use mathematical optimization techniques to find out an equation that best fit the data.
Linear Regression using Least Square Principle
Suppose 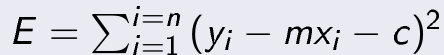 Then least square principle states that, find out the value of m and c such that value of E is minimum.
See the calculation below
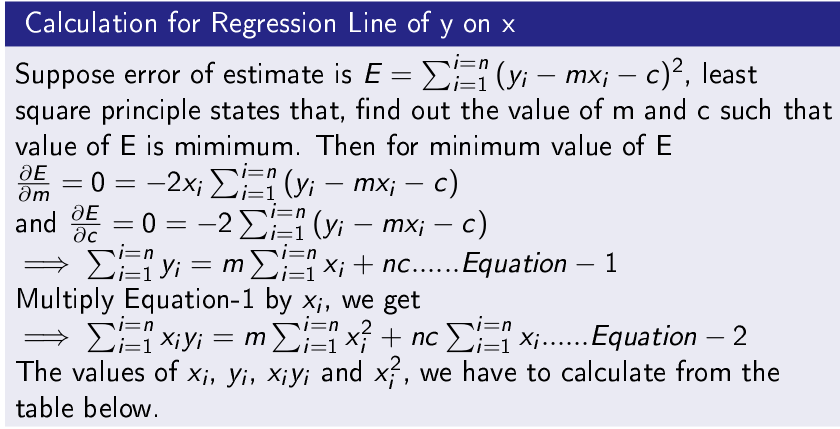
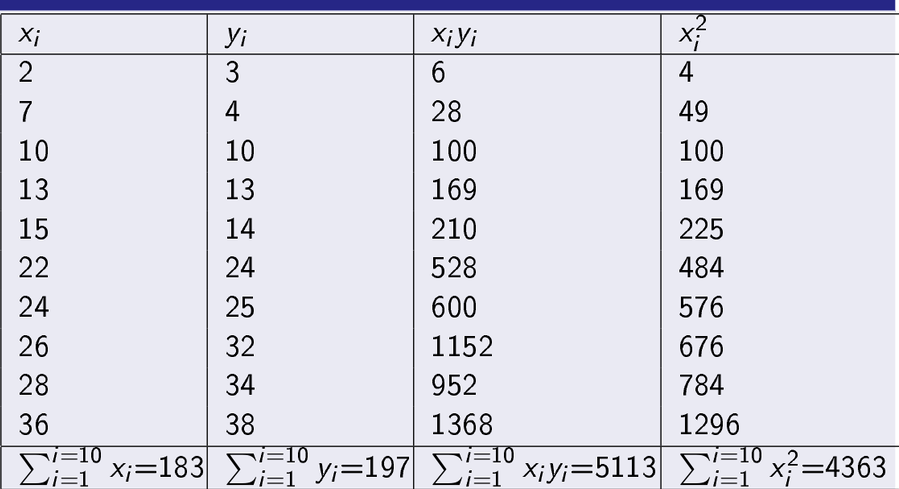
Then we will get two equations of two variables m and c.\\
And if we solve and put in y = mx+c we will get regression line of y on x.\\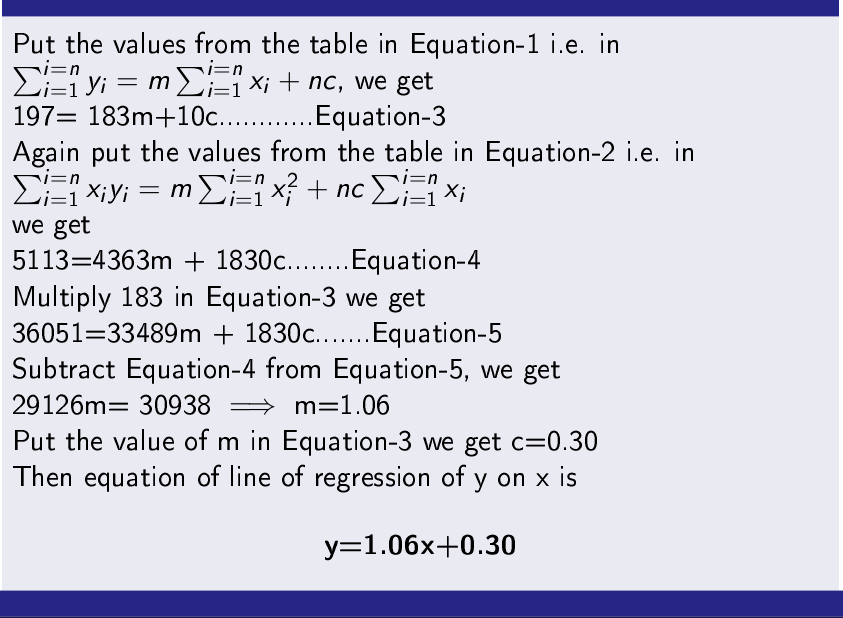
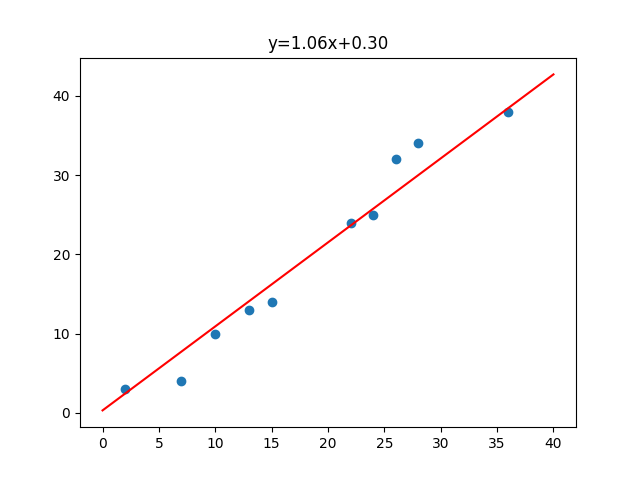
import numpy as np
import matplotlib.pyplot as plt
u=[2,7,10,13,15,22,24,26,28,36]
v=[3,4,10,13,14,24,25,32,34,38]
x = np.linspace(0,40,38)
print(x)
y=1.06 * x + 0.30
plt.title(“y=1.06x+0.30”)
plt.scatter(u, v)
plt.plot(x, y, ‘-r’)
plt.savefig(“scatter.png”)
Conclusion
In this post, I have explained about linear regression using least square principle. Further, it has a lot of applications in variety of fields such as, finance, economics, stock market and medical science. Hope you will apply in your own field.