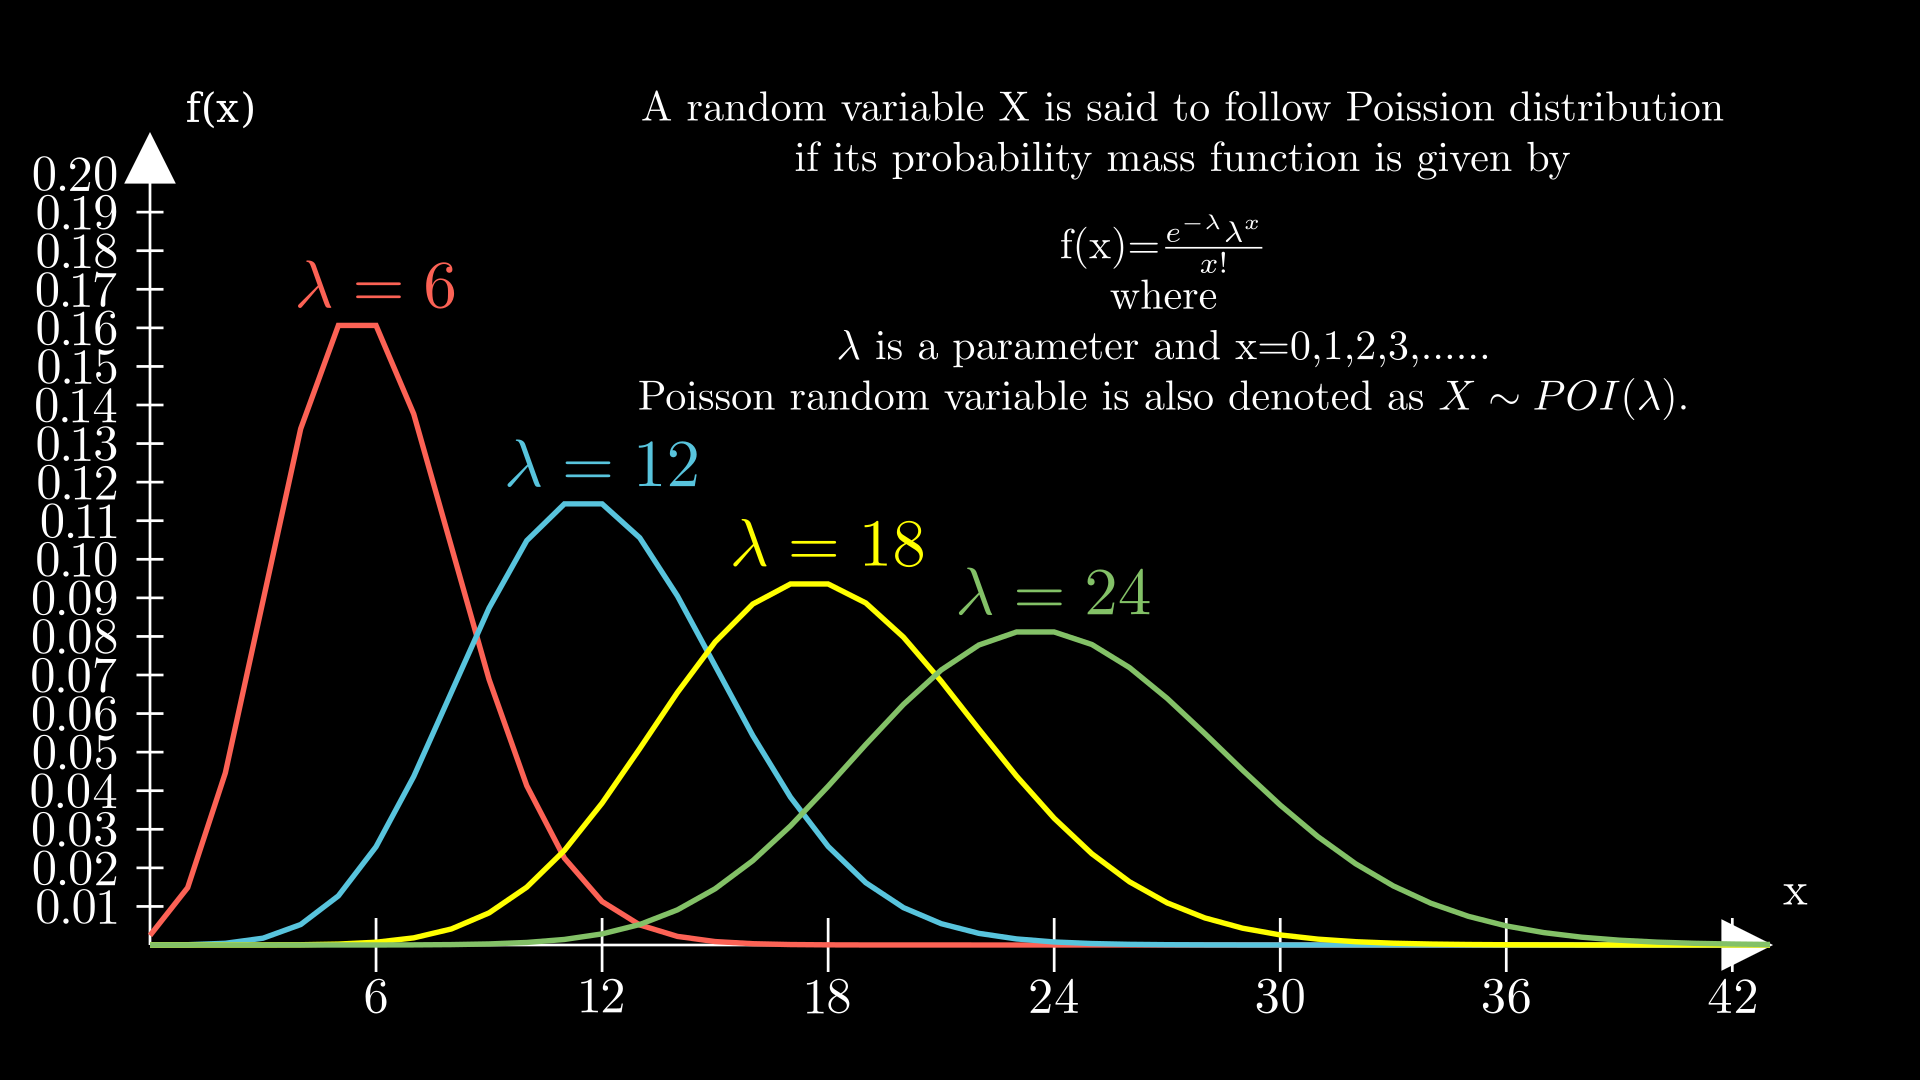
The Poisson distribution is defined by a single parameter, usually denoted by λ (lambda), which represents the average rate of occurrence of the events. The probability mass function (PMF) of the Poisson distribution is given in the image above.
It’s worth noting that the Poisson distribution is a limiting case of the binomial distribution for rare events as the number of trials (n) approaches infinity and the probability of success (p) approaches zero, while keeping the product np constant.
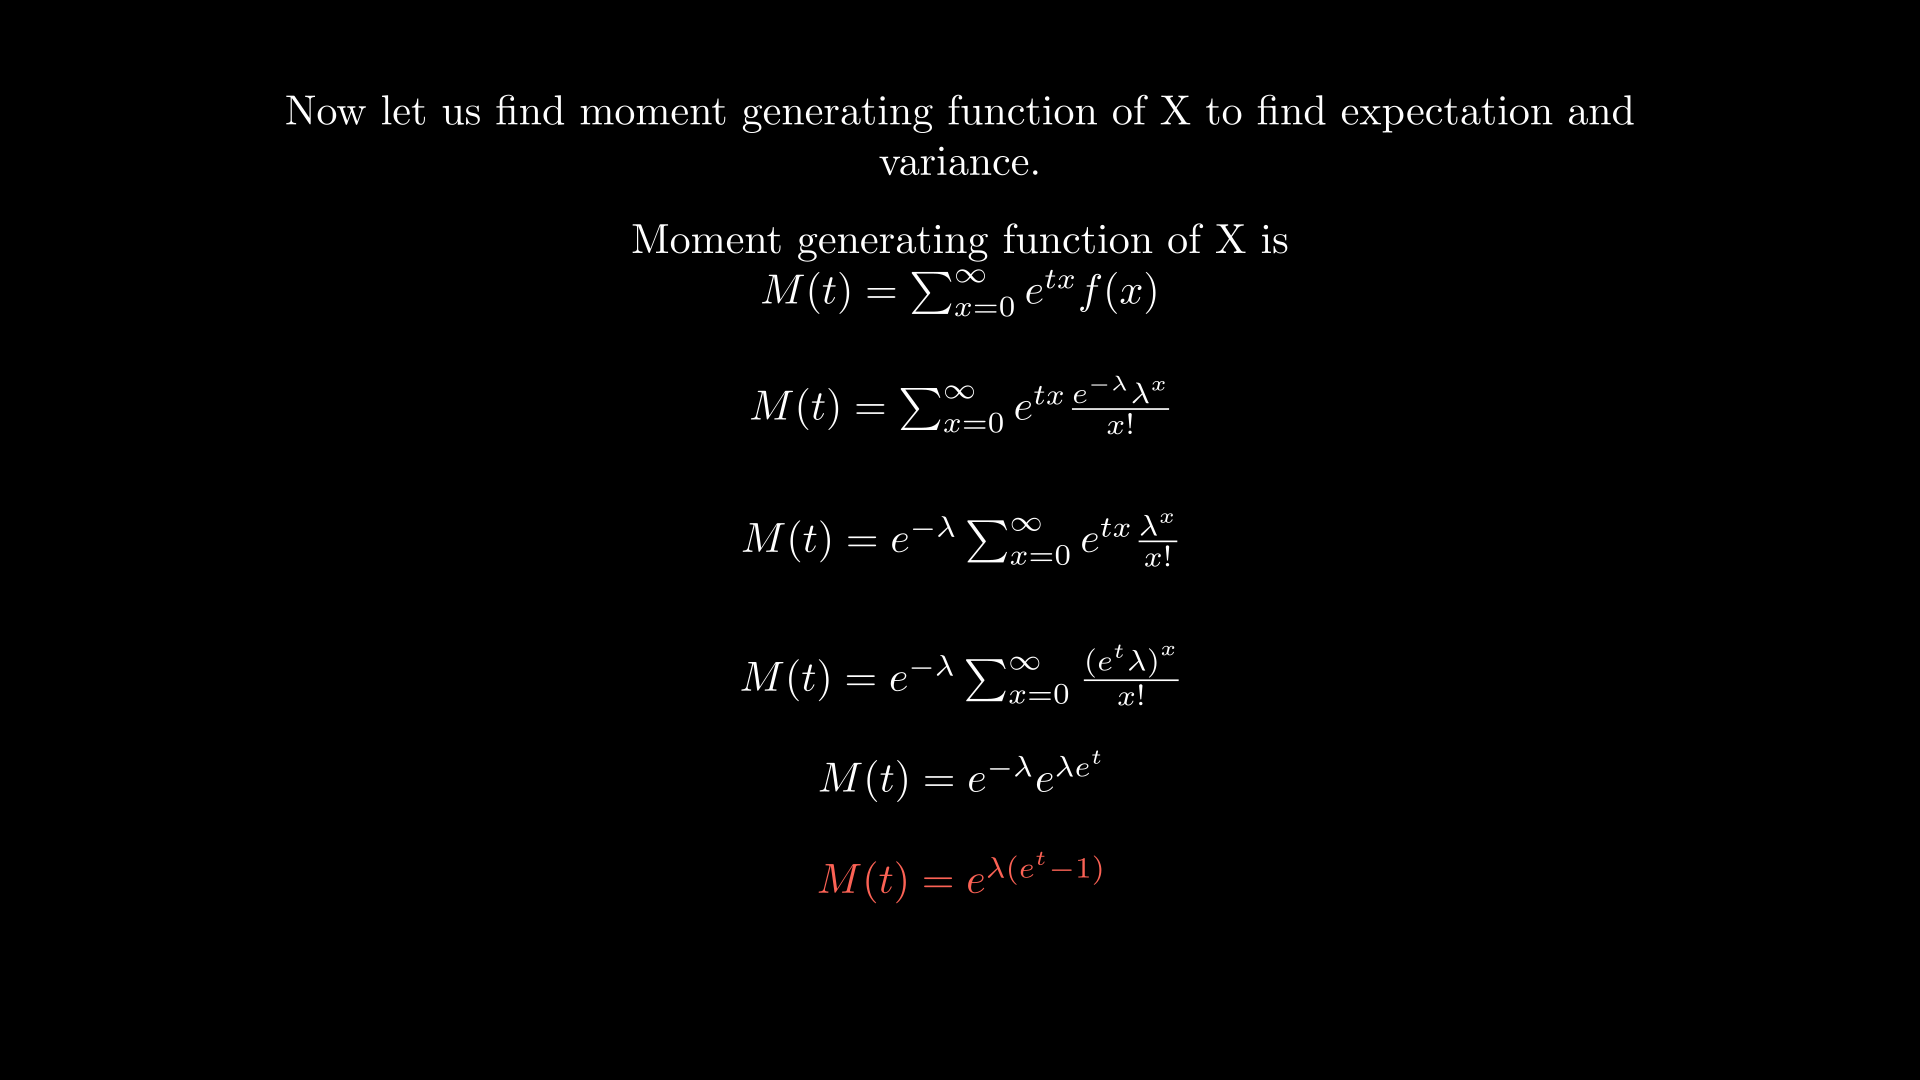
Moment Generating Function of Poisson Random Variable
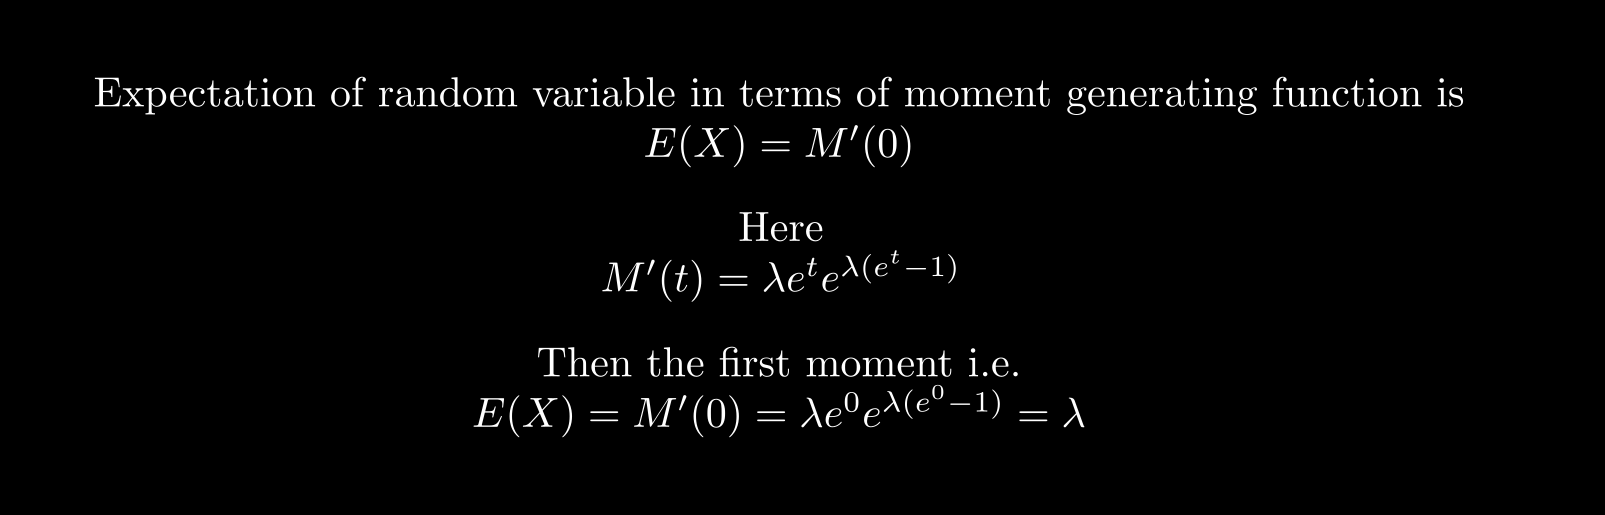
Expectation Poisson Distribution Random Variable
The expectation, or mean, of a Poisson random variable is equal to its parameter λ. In mathematical terms, if X is a Poisson random variable, then its expectation E(X) is given by:
E(X)=λ
Where λ is the average rate at which events occur in a fixed interval of time or space. See how expectation is calculated using moment generating function.
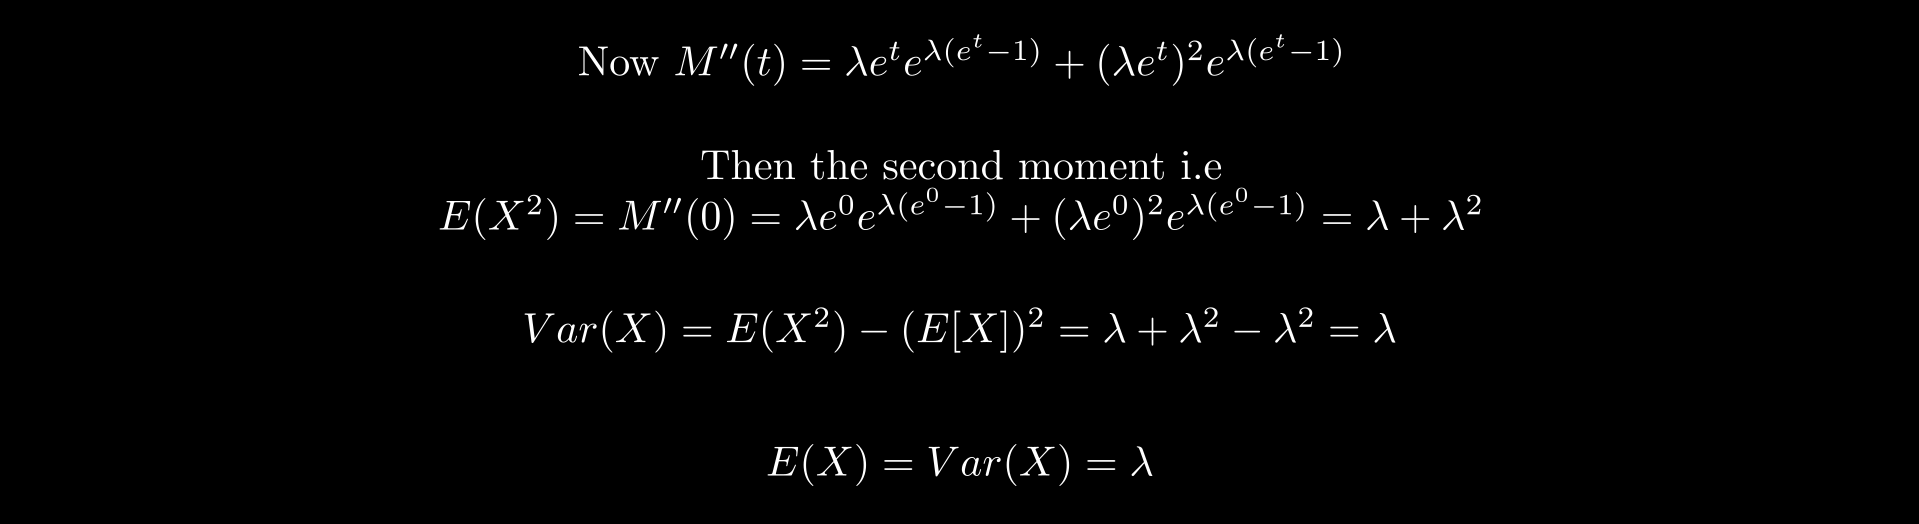
Variance of Poisson Random Variable
The variance of a Poisson random variable is also equal to its parameter λ. In mathematical terms, if X is a Poisson random variable, then its variance Var(X) is given by:
Var(X)=λ
So, the variance of a Poisson distribution is also λ, which is the average rate at which events occur in a fixed interval of time or space.