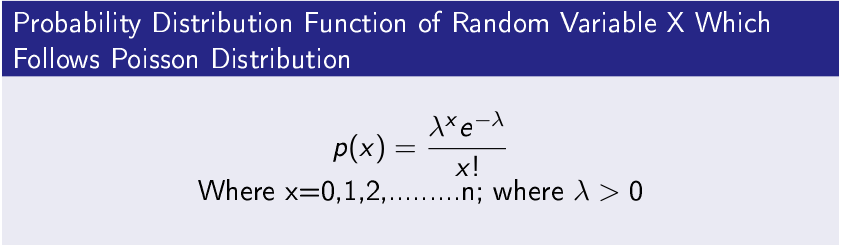
A random variable X is said to follow Poisson distribution, if it follows the following probability distribution function.
Poisson distribution is a discrete probability distribution.
It models the following types of problems
- Find out number of new born babies in a city in certain time duration.
- Find out defective materials in manufactured by a company.
- Number of printing errors in a page.
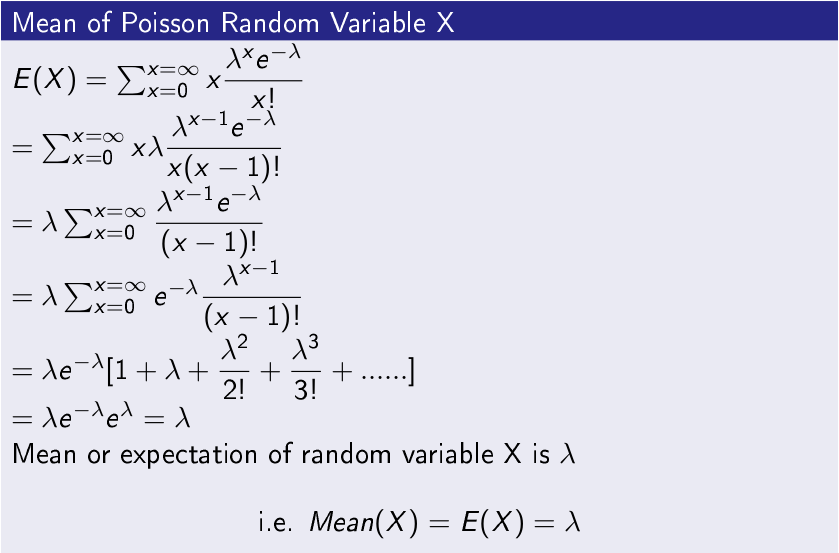
Mean of Poisson Distribution’s Random Variable X-
Mean of Poisson distribution’s random variable X is derived below
Numerical Problem Poisson Distribution
Question-
A company manufactures 10 materials in a day in which 10% are defective, calculate the probability that at least two materials will not be defective.
Answer-
Here n=10 p=10%=1/10
Then λ=n p= 10 * (1/10)=1
Then we have to calculate
probability that at least two materials will not be defective.
P(X=0)+P(X=1)+P(X=2) = λ0 e-1 /0! + λ1 e-1/1! + λ2 e-1/2!
Calculate it yourself
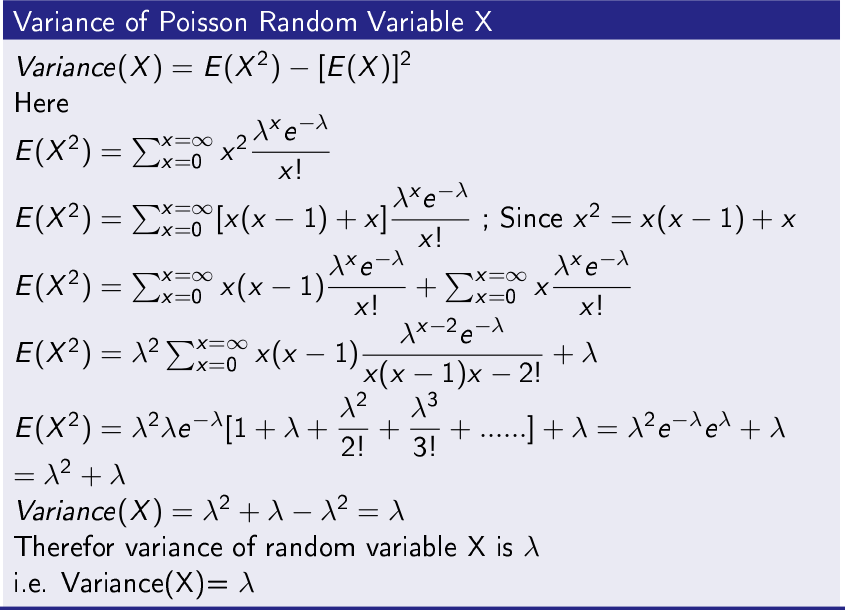
Variance of Poisson Distribution Random Variable X-
Variance of Poisson distribution’s random variable X is derived below
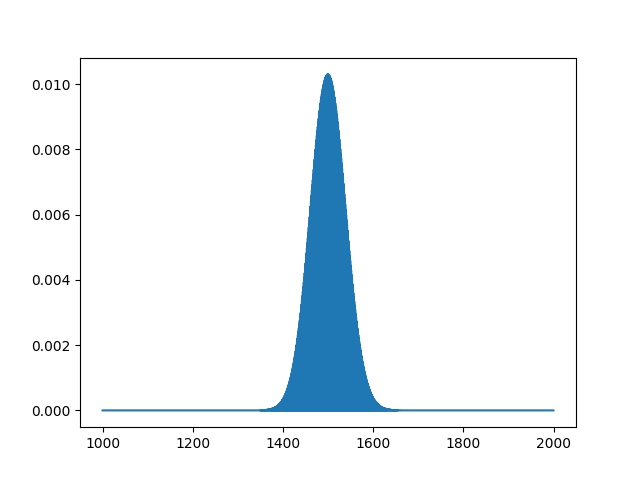
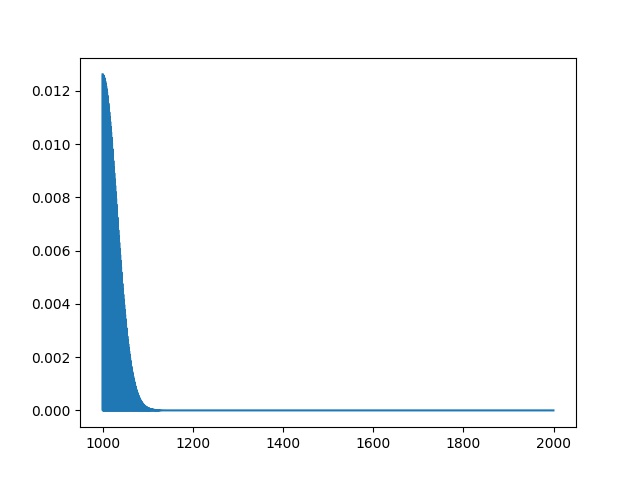
Python Code for Poisson Distribution
from scipy.stats import poisson
import numpy as np
import matplotlib.pyplot as plt
x= np.arange(1000,2000,0.5)
plt.plot(x, poisson.pmf(x,1500))
plt.savefig(“poisson.jpg”)
Output
When mean p=0.50 and mean=1500
When mean p=0.50 and mean=1000
Conclusion
To sum up, in this post I have explained about Poisson distribution and its applicability is domains. Hope you will understand and apply.