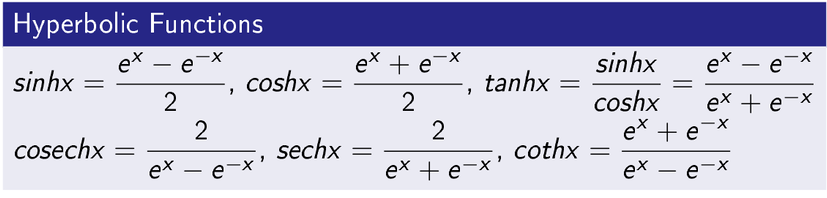
Hyperbolic Functions
These functions are very important in regression, classification and to build neural networks. Moreover, it is important to remember expression hyperbolic functions in the form of exponential functions. I have written the expressions and plotted the functions using python library.
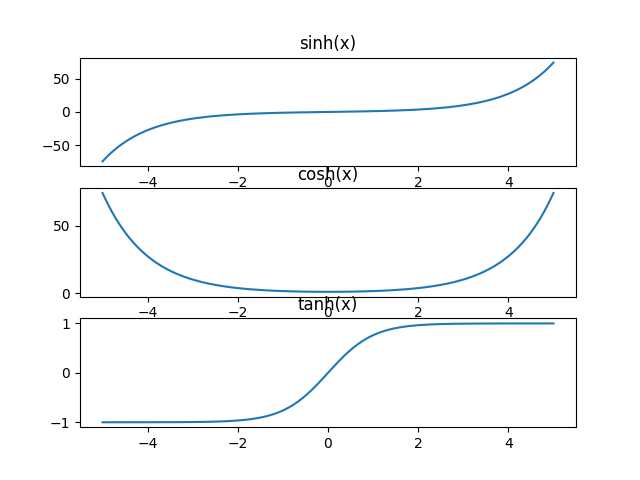
Python Codes to Plot Hyperbolic Functions
import numpy as np
import matplotlib.pyplot as plt
x= np.linspace(-5,5,100)
plt.subplot(3,1,1)
plt.title(“sinh(x)”)
y=np.sinh(x)
plt.plot(x,y)
plt.subplot(3,1,2)
plt.title(“cosh(x)”)
y=np.cosh(x)
plt.plot(x,y)
plt.subplot(3,1,3)
plt.title(“tanh(x)”)
y=np.tanh(x)
plt.plot(x,y)
plt.savefig(“hyperbolic.png”)
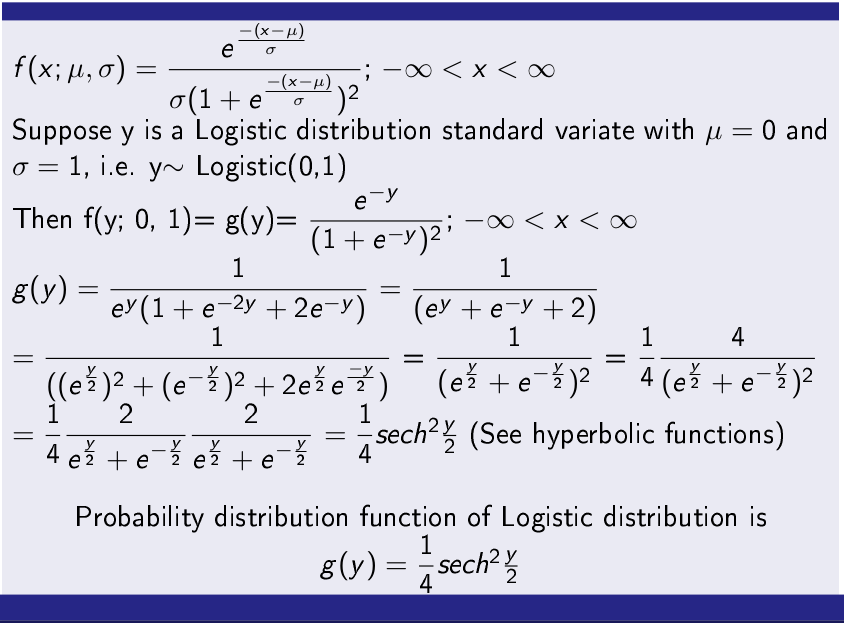
Logistic Probability Distribution Function
A random variable X is said to follow Logistic distribution if it follows the following probability mass function.
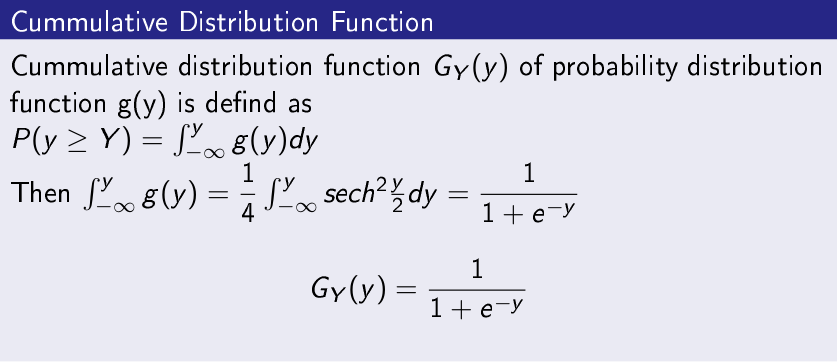
Cumulative Distribution Function of Logistic Distribution
The Cumulative Distribution Function (CDF) is used to classification problems in data science, machine learning and deep learning. Function name is popularly called Logistic function or sigmoid function.
Logistic Regression
Logistic regression uses Logistic function and is a very important classification technique used in several fields of study. One of the irony with its name that it is used for classification, however, sir name is regression. Basically, the output of Logistic regression is a real number
and value is bounded between 0 and 1. It is is used for classification problem in the following way. If value of y is less than 0.50 it denotes class-1 and greater than 0.50 it denotes class-2.
Example of Logistic Regression
To demonstrate the Logistic regression, I have taken heart disease data from Kaggle (Link https://www.kaggle.com/ronitf/heart-disease-uci#heart.csv), which have 13 features (attributes) and a target class. Further, they are described below.
Note- The explanation has been taken from https://www.kaggle.com/ronitf/heart-disease-uci#heart.csv
Age —> age in years
Sex—> (1 = male; 0 = female)
cp—- chest pain type
trestbps—> resting blood pressure (in mm Hg on admission to the hospital)
chol—> serum cholestoral in mg/dl
fbs—> (fasting blood sugar > 120 mg/dl) (1 = true; 0 = false)
restecg—> resting electrocardiographic results
thalach—> maximum heart rate achieved
exang—> exercise induced angina (1 = yes; 0 = no)
oldpeak—>ST depression induced by exercise relative to rest
slope—>the slope of the peak exercise ST segment
ca—> number of major vessels (0-3) colored by flourosopy
thal—> 3 = normal; 6 = fixed defect; 7 = reversable defect
Target Classes—> 1 or 0, [1= A patient has heart disease], [0= A patient does not have heart disease]
sklearn (Machine Learning Library in Python) Code for Logistic Regression
scikit-learn python library for machine library has a very rich library of machine learning classification algorithms. For
Logistic Regression it provides LogisticRegression class and and object of LogisticRegression class can be created which calls fit() function to train a model and predict() function to label unseen cases.
import sys, os
import matplotlib.pyplot as plt
from sklearn.model_selection import train_test_split, GridSearchCV
import pandas as pd
from sklearn.metrics import confusion_matrix
from sklearn.linear_model import LogisticRegression
import matplotlib
from pylab import *
dataset=pd.read_csv(“heart.csv”, header=None, na_values=”NaN”)
dataset.head()
X = dataset.iloc[:, :-1].values
y = dataset.iloc[:,-1].values
print(y)
print(X)
X_train, X_test, y_train, y_test = train_test_split(X, y, test_size = 0.20, random_state=0)
#lr= LogisticRegression()
lr=LogisticRegression(solver=’lbfgs’, C=1e5, multi_class=’binomial’)
lr.fit(X_train, y_train)
y_lrpredict = lr.predict(X_test)
print(” Accuracy: {}%”.format(lr.score(X_test, y_test) * 100 ))
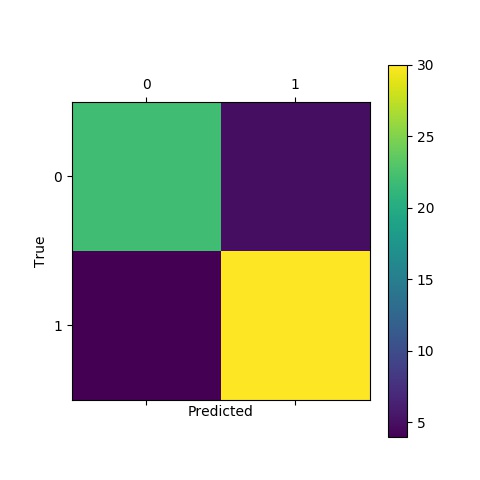
lr_cm = confusion_matrix(y_test, y_lrpredict)
print(” Confusion Matrix\n”,lr_cm)
plt.title(‘Confusion Matrix of Classifiers’)
plt.matshow(lr_cm)
plt.xlabel(‘Predicted’)
plt.ylabel(‘True’)
plt.colorbar()
plt.savefig(“Logistic Regression.jpg”)
Performance Analysis
Accuracy: 85.24590163934425%
Confusion Matrix
[[22 5]
[ 4 30]]
Conclusion-
Logistic regression is very important classification technique borrowed from statistics which is used for classification. In this post, I have explained Logistic distribution and Logistic regression in python. Moreover, understanding hyperbolic functions are very important to understand many classifiers and regression algorithms in machine learning. I have also explained hyperbolic functions. Hope you will understand and use in applications.