Statistics

How to Compute  Deciles

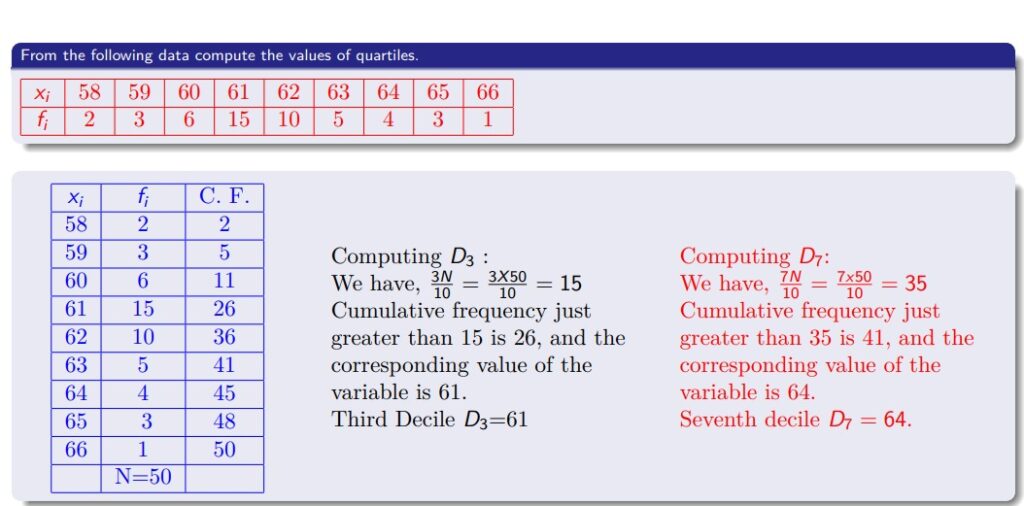
    How to Compute  Deciles In this lesson, we are going to learn how to calculate the values of  deciles, a using the given data. This guide will walk you through the computation process. Example Data The data provided is: Variable (xi) Frequency (fi) Cumulative Frequency (C.F.) 58 2 2 59 3 5 60 […]

How to Compute  Deciles Read More »

Deciles

Deciles Calculation and Visualization

Hello everyone! Welcome back to Postnetwork Academy. I’m Bindeshwar Singh, and today we’re going to uncover a key concept in statistics that helps you understand data more deeply—deciles! Have you ever wondered how to break down a data set into smaller, meaningful parts? Deciles allow us to split data into 10 equal sections, giving us

Deciles Calculation and Visualization Read More »

Data Science and A.I. : Computing Quartiles from Grouped Data: Step-by-Step Guide

Quartiles help to divide a dataset into four equal parts. In this post, we will compute the values of the lower quartile (Q₁), median (Q₂), and upper quartile (Q₃) from a given set of grouped data. Data: | C.I. | fᵢ | |——-|—–| | 5-10 | 5 | | 10-15 | 6 | | 15-20

Data Science and A.I. : Computing Quartiles from Grouped Data: Step-by-Step Guide Read More »

variance

Data Science and A.I. : Measures of Dispersion : Variance of Continuous Freq. Distribution

In this post, we dive into one of the core statistical concepts used in data science and artificial intelligence—calculating the variance of a continuous frequency distribution. Breaking down the steps If you have data distributed across class intervals with frequencies, the goal is to find the variance. The video explains the columns in the table:

Data Science and A.I. : Measures of Dispersion : Variance of Continuous Freq. Distribution Read More »

Poisson Distibution

Poisson Distribution in Statistics and Mathematics

Poisson Distribution- The Poisson distribution is defined by a single parameter, usually denoted by λ (lambda), which represents the average rate of occurrence of the events. The probability mass function (PMF) of the Poisson distribution is given in the image above. Poisson Distribution is Limiting Case of Binomial Distribution It’s worth noting that the Poisson

Poisson Distribution in Statistics and Mathematics Read More »

Random Variable and Probability Mass Function

Random Variable and Probability Mass Function

Random variable   is a very  important concept in probability, statistics, data science and machine learning, one must  learn concept of random variable and related concepts. In this post, I have explained random variable and probability mass function that will help you to have basic understanding of  random variable and probability mass function. To understand random

Random Variable and Probability Mass Function Read More »

Covariance and Correlation

Covariance and Correlation

Covariance and Correlation- Covariance and correlation both measure linear relationship between two variables.  However, they differ at some points. In this post I will explain covariance and correlation and how they differ from each other. Covariance between two variables is written as Cov(X,Y) and is defined as Calculation of Covariance If you look at the

Covariance and Correlation Read More »

©Postnetwork-All rights reserved.