Covariance and Correlation-
Covariance and correlation both measure linear relationship between two variables. However, they differ at some points. In this post I will explain covariance and correlation and how they differ from each other.
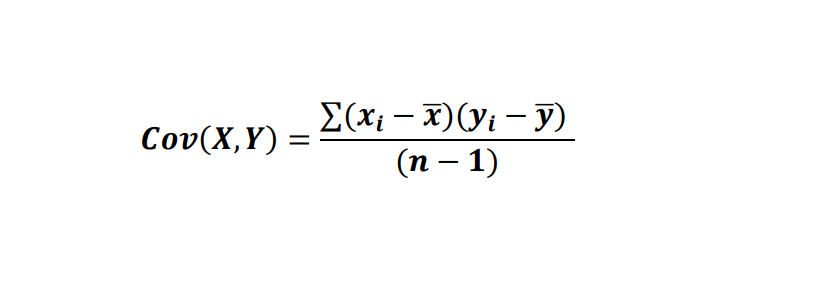
Covariance between two variables is written as Cov(X,Y) and is defined as
i X Y xd yd xd * yd
1 1 1 -2 -2 4
2 2 2 -1 -1 1
3 3 3 0 0 0
4 4 4 1 1 1
5 5 5 2 2 4
Calculation of Covariance
If you look at the table you will get
x̄ = (1+2+3+4+5)/5
x̄=3
ȳ = (1+2+3+4+5)/5
ȳ=3
From table you can see that
xd=[-2, -1, 0, 1, 2]
where xd=(xi – x̄)
And
yd=[-2,-1, 0, 1, 2]
where yd=(yi – ȳ)
Now
xd * yd= [4, 1,0, 1, 4]
and
Σ xd * yd= 10
Here number of observations
n=5
If you calculate covariance between X and Y it would be
Cov(X, Y)=( ∑xd * yd )/n-1
Cov(X, Y)= 10/4 =2.5 (Positive)
From the above result( covariance between X and Y is 2.5) you can only say about direction of relation. When X is increasing then Y is also increasing, however, you can not say strength of relationship you can say only about direction.
Calculation of Variance when Y is Reversed
Now let us reverse data of Y and calculate the covariance between X and Y.
i x y xd yd xd * yd
1
1 5 -2 2 -4
2 2 4 -1 1 -1
3 3 3 0 0 0
4 4 2 1 1 -1
5 5 1 2 2 4
If you look at the table you will get
x̄ = (1+2+3+4+5)/5
x̄=3
ȳ = (5+4+3+2+1)/5
ȳ=3
From table you can see that
xd=[-2, -1, 0, 1, 2]
where xd=(xi – x̄)
And
yd=[2,1, 0, -1, -2]
where yd=(yi – ȳ)
Now
xd * yd= [-4, -1,0, -1, -4]
and
Σ xd * yd= -10
Here number of observations
n=5
If you calculate covariance between X and Y it would be
Cov(X, Y)=( ∑xd * yd )/n-1
Cov(X, Y)= -10/4 =2.5 (Positive)
From the above result( covariance between X and Y is -2.5) you can only say about direction of relation. When X is increasing then Y is decreasing, however, you again can not say strength of relationship you can say only about direction.
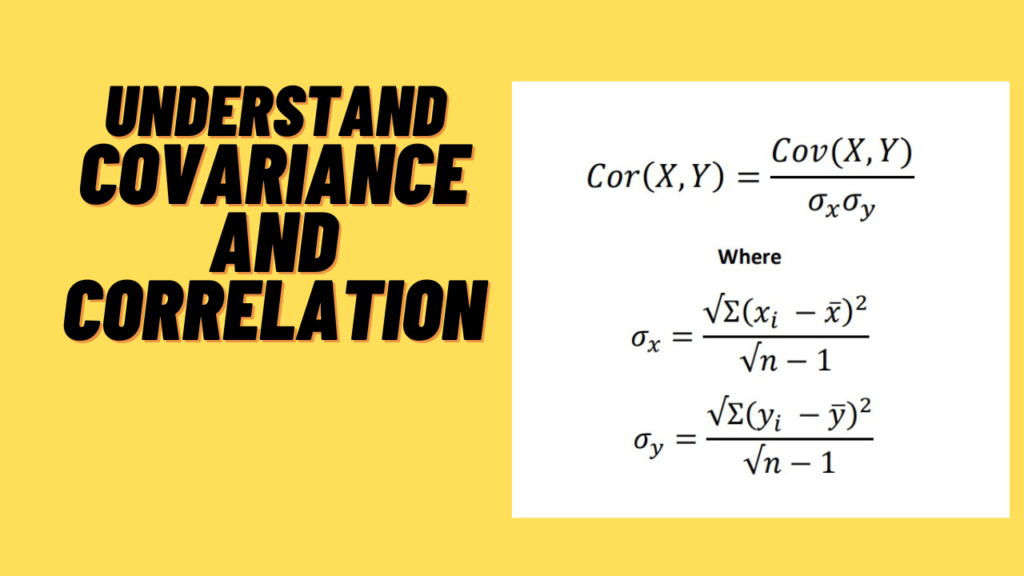
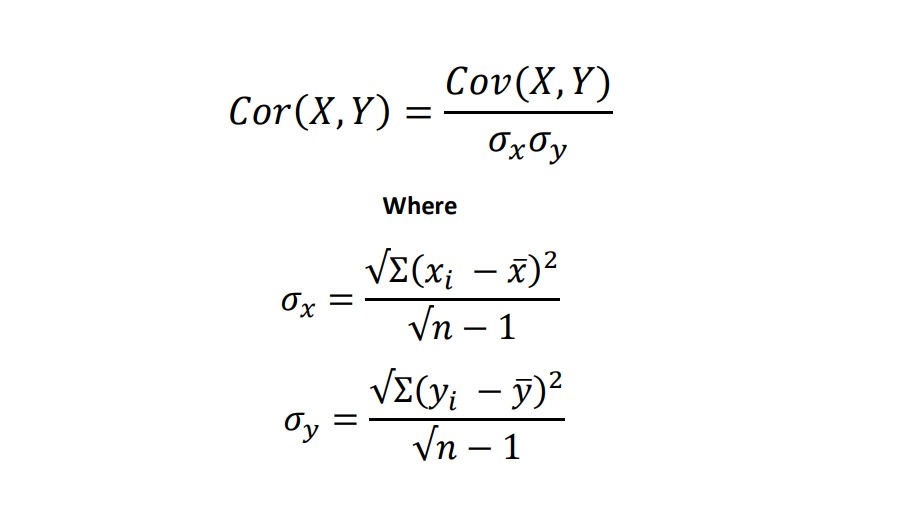
Correlation
Correlation is a standardized version version of covariance and it can measure direction and strength of relationship. Furthermore, the range of correlation is between [-1, +1]. So, when the value of correlation is +1 then there is positive and perfect correlation. When the value of correlation is 0 then there is no correlation. When the value of correlation is -1 then there is negative and perfect correlation.
Correlation is denoted as Cor(X, Y) and defined as
Now let us calculate correlation for the data which is given in the below table.
i x y xdsqr xdsqr
1 1 1 4 4
2 2 2 1 1
3 3 3 0 0
4 4 4 1 1
5 5 5 4 4
From table
xdsqr=(xi – x̄)²
ydsqr=(yi – ȳ)²
From the above table the value of
Σ(xi – x̄)²=10
and
n=5
σx=√10⁄4
σx=√2.5
From the above table the value of
Σ(yi – ȳ)²=10
and
n=5
σy=√10⁄4
σy=√2.5
Cor(X, Y)= 2.5 ⁄√2.5 * √2.5 =1
The value of correlation is +1 it means that there is a perfect and positive correlation between X and Y.
Now let us calculate correlation for the data which is given in the below table.
i x y xdsqr ydsqr
1 1 5 4 4
2 2 4 1 1
3 3 3 0 0
4 4 2 1 1
5 5 1 4 4
From table
xdsqr=(xi – x̄)²
ydsqr=(yi – ȳ)²
From the above table the value of
Σ(xi – x̄)²=10
and
n=5
σx=√10⁄4
σx=√2.5
From the above table the value of
Σ(yi – ȳ)²=10
and
n=5
σy=√10⁄4
σy=√2.5
Cor(X, Y)= -2.5 ⁄√2.5 * √2.5 =1
The value of correlation is -1 it means that there is a perfect and negative correlation between X and Y.
See the video
You can download PDF related to the video
Link to download- Correlation PDF
1-http://pstatisticstutorials.com/wp-content/uploads/2019/02/Math662TB-09S-1.pdf
2-https://en.wikipedia.org/wiki/Covariance_and_correlation
3-https://mathworld.wolfram.com/StatisticalCorrelation.html